Drawing method and visual language
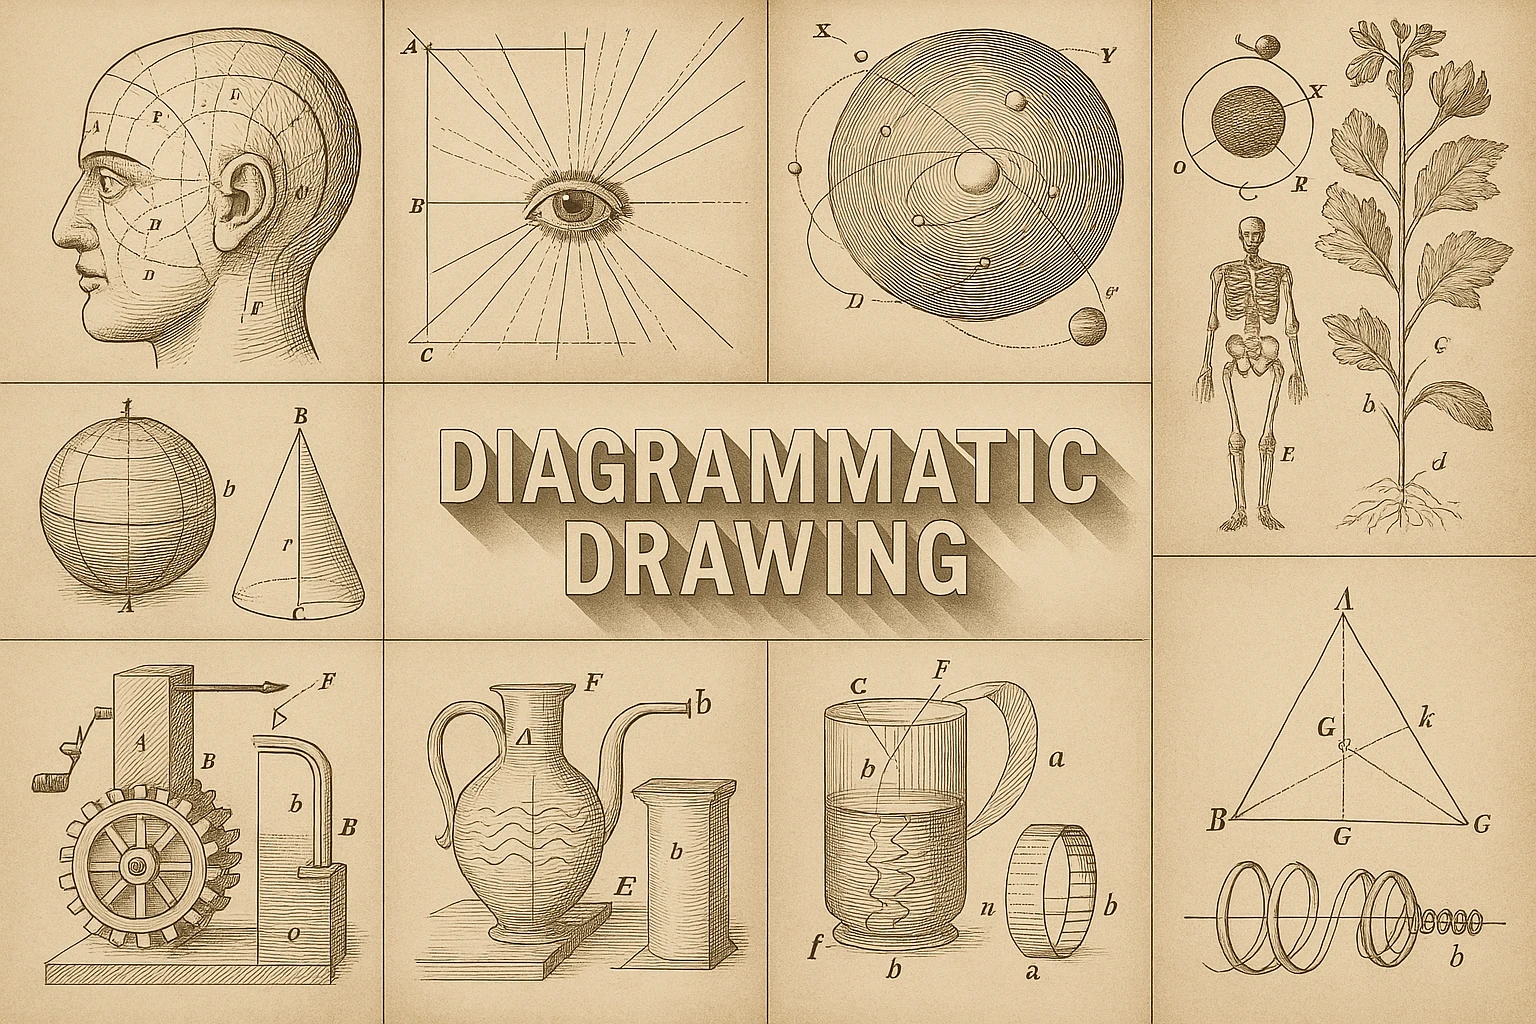
Diagrammatic drawing uses lines, nodes, arrows, layers and spatial arrangements to show relationships. Explore its artistic possibilities while keeping visual suggestion separate from evidence and measurement.
A visual introduction
Select an image for a closer look. Use the thumbnails, arrow keys or a swipe to compare examples. Zoom in to inspect details, or share the image that inspires you.
Creative toolbox · take this style further
Choose an input and a destination. Search sends your words to the chosen site; Copy & open puts them on your clipboard to paste there.
Create with AI
Turn your chosen input into an image prompt or a new creative direction.
ChatGPT
Copy your input and paste it into a ChatGPT conversation or image request.
Copy & open ChatGPT (new tab)Claude · Anthropic
Develop an image prompt or explore the style in a new Claude conversation.
Copy & open Claude · Anthropic (new tab)Midjourney
Paste your input into the Imagine bar on the Create page.
Copy & open Midjourney (new tab)Adobe Firefly
Copy your input, open Firefly, and paste it into the prompt field.
Copy & open Adobe Firefly (new tab)Leonardo.Ai
Copy your input, open Leonardo, and paste it into the generation field.
Copy & open Leonardo.Ai (new tab)Image search
Find visual references. Short, concrete keywords usually work best.
Lexica
Search AI images and prompts using your selected input.
Search with this input Lexica (new tab)Pexels
Search the photo and video library. Short keywords often work best.
Search with this input Pexels (new tab)Pixabay
Search photos, illustrations and other images.
Search with this input Pixabay (new tab)Unsplash
Search photographs using the style name or your own keywords.
Search with this input Unsplash (new tab)Wikimedia Commons
Search photographs, artworks and historical images. Check each file for its source and reuse terms.
Search with this input Wikimedia Commons (new tab)Art & research
Explore artists, collections and the ideas behind a style.
Wikipedia
Search for background reading. A style may not have its own article.
Search with this input Wikipedia (new tab)WikiArt
Copy your input into WikiArt’s search to explore artists and artworks.
Copy & open WikiArt (new tab)Europeana
Paste your keywords into the search to explore European museum, library and archive collections.
Copy & open Europeana (new tab)Inspiration
Discover portfolios and visual ideas from creative communities.
Instagram hashtags
Search a hashtag made from your input: spaces and punctuation are removed. Instagram may require sign-in.
Search with this input Instagram hashtags (new tab)ArtStation
Paste your input into artwork search for concept art, environments, characters and visual development.
Copy & open ArtStation (new tab)Behance
Paste your input into project search for illustration, design and visual storytelling.
Copy & open Behance (new tab)A closer look
Nodes and connecting paths; directional arrows; repeated symbols; layers and sequences; selective annotation; spacing and line hierarchy that communicate relationships rather than optical appearance.
Drawing a relationship rather than a view
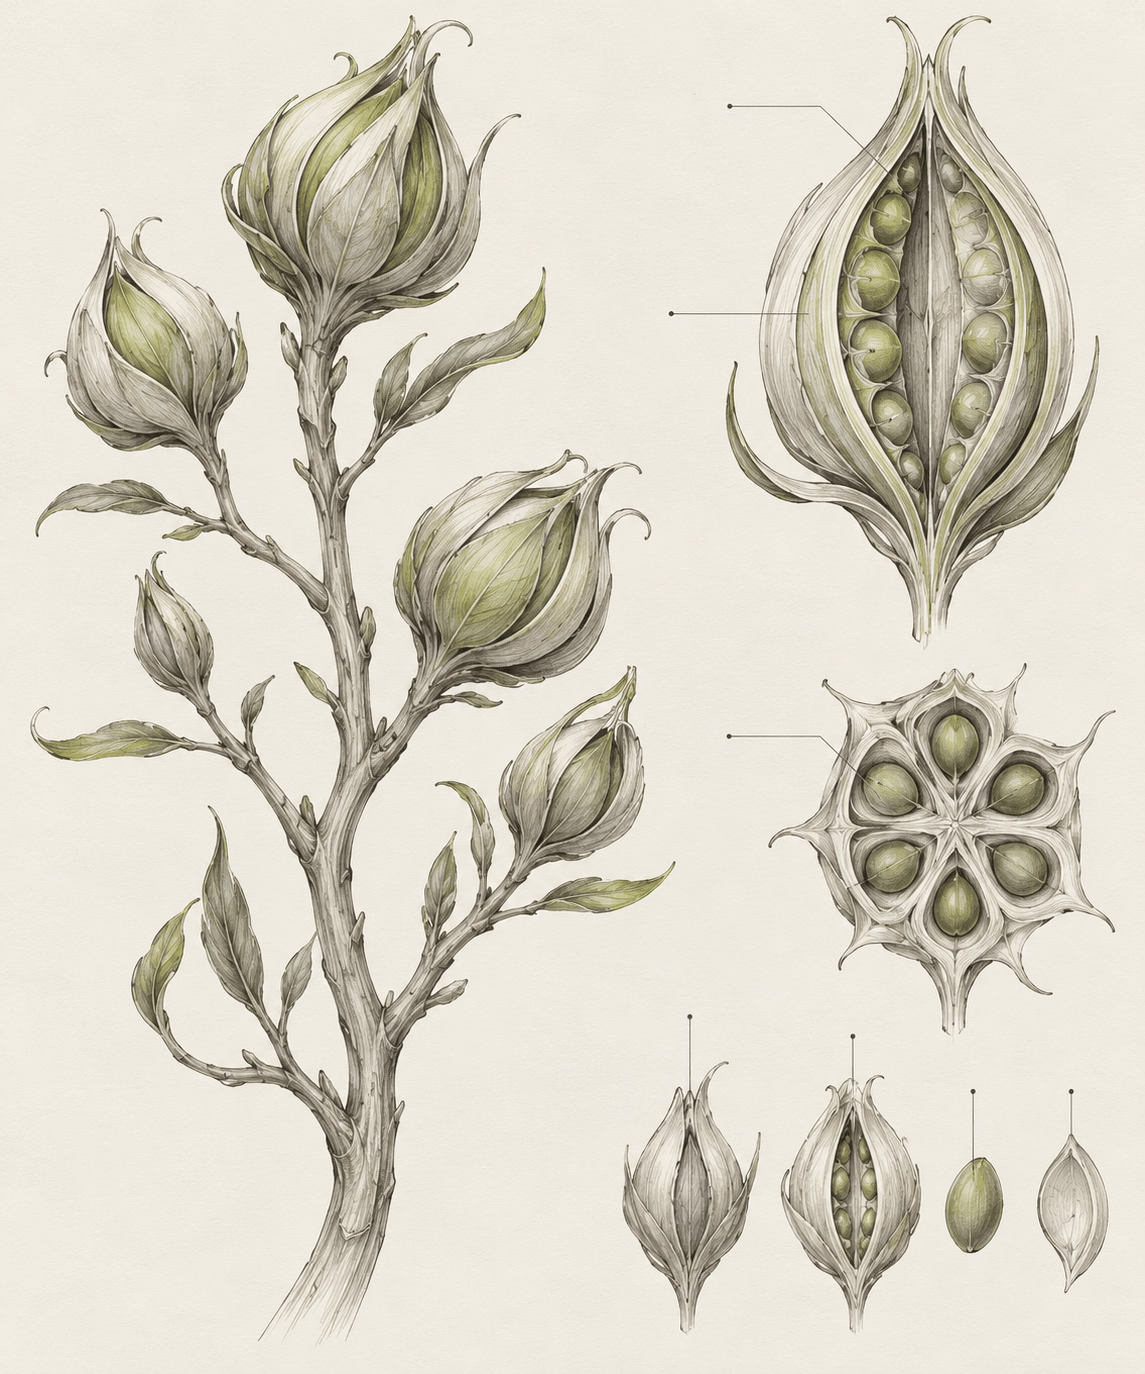
A diagrammatic drawing organizes relationships: what connects, contains, follows, changes or depends on something else. It may simplify a physical object or describe something that has no single visible form. The term names a method and visual language, not one historical art movement. Technical illustration, maps and artistic diagrams can share devices while making different kinds of claims.
Mark Lombardi offers a documented artistic example. The Whitney describes his pencil drawings as narrative structures concerned with networks of power and influence, while MoMA’s archive preserves the published-source index cards behind his research. His work demonstrates that a diagram can be both a carefully composed drawing and an inquiry supported by an extensive information practice.
Every mark needs a role
Before drawing connections, decide what a node represents and what a line means. A line might indicate proximity, sequence, exchange or a proposed association; these are not interchangeable. An arrow adds direction, but does not automatically prove causation. A diagram becomes misleading when one visual convention quietly carries several different meanings.
In a purely invented artwork, the system may be poetic rather than factual. It can map imagined memories or a fictional garden. Say so clearly. If the drawing concerns real people, events or measurements, its relationships need evidence. The calm authority of precise lines is not a substitute for a reliable source.
Hierarchy makes complexity readable
Start with the principal relationship and give it enough space. Secondary connections can use lighter lines, smaller nodes or a separate region. Crossings are sometimes unavoidable, but unnecessary crossings make the eye work without adding information. Group related elements and use the gaps between groups as part of the structure.
A diagram can also deliberately retain complexity. The Whitney notes that Lombardi’s drawings do more than simplify information: their arcs and networks make entanglement perceptible. The artistic question is therefore not always “How can this be made simpler?” It may be “Which kind of complexity must remain visible for the subject to be understood?”
The surface still carries expression
Graphite, ink, coloured pencil and digital line each produce a different register. A lightly revised pencil path can reveal uncertainty; a crisp geometric line can suggest a formal system. Neither is inherently more truthful. Choose the material and degree of finish according to the work’s purpose, and make revisions intentional rather than accidental-looking clutter.
Colour should have a job. One accent can distinguish a route, a category or a change of state. Too many unrelated hues make the key harder to infer. Similarly, a large node suggests importance unless the drawing explains otherwise. Scale, placement and contrast all carry implications, even when no numerical labels are present.
From analysis to imaginative use
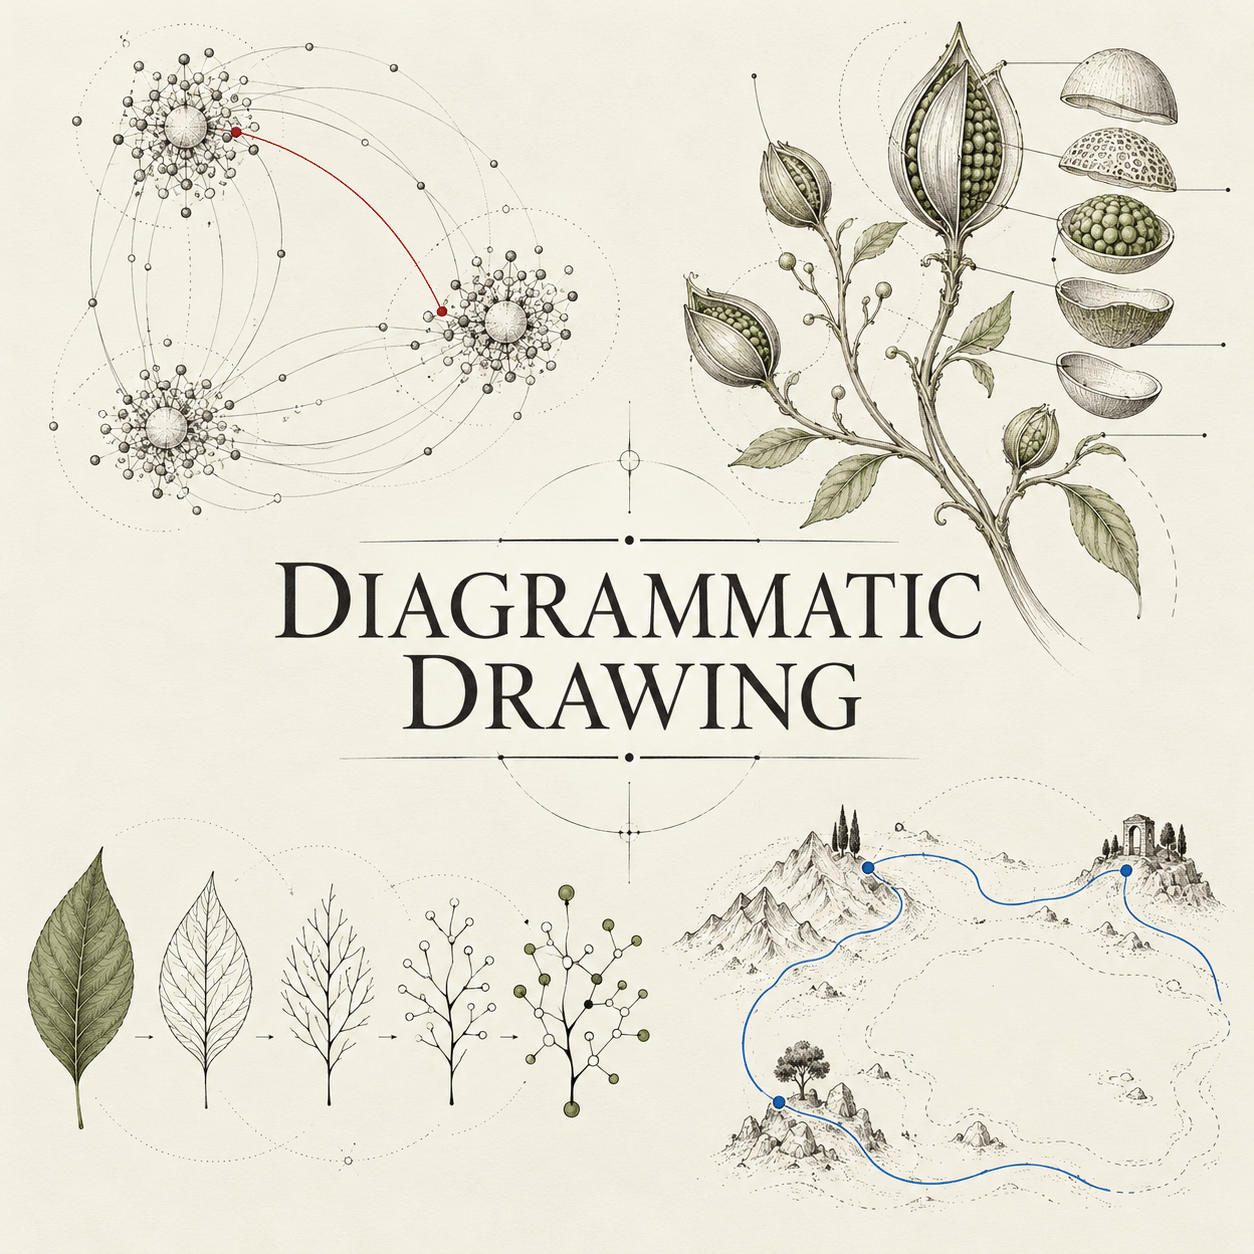
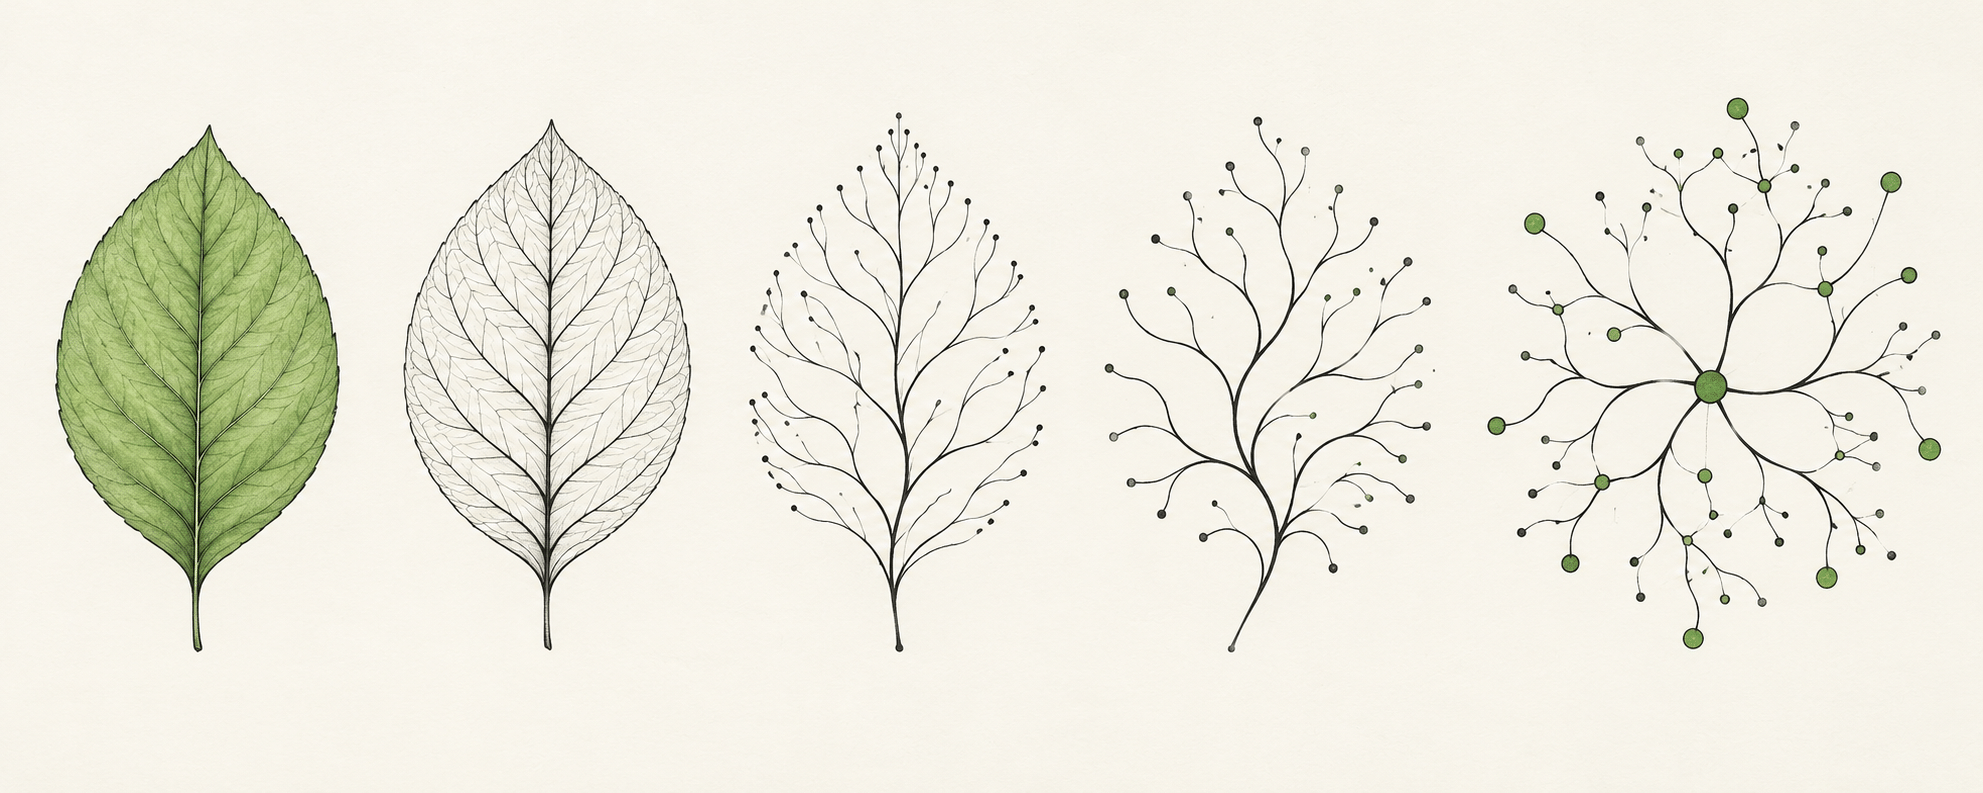
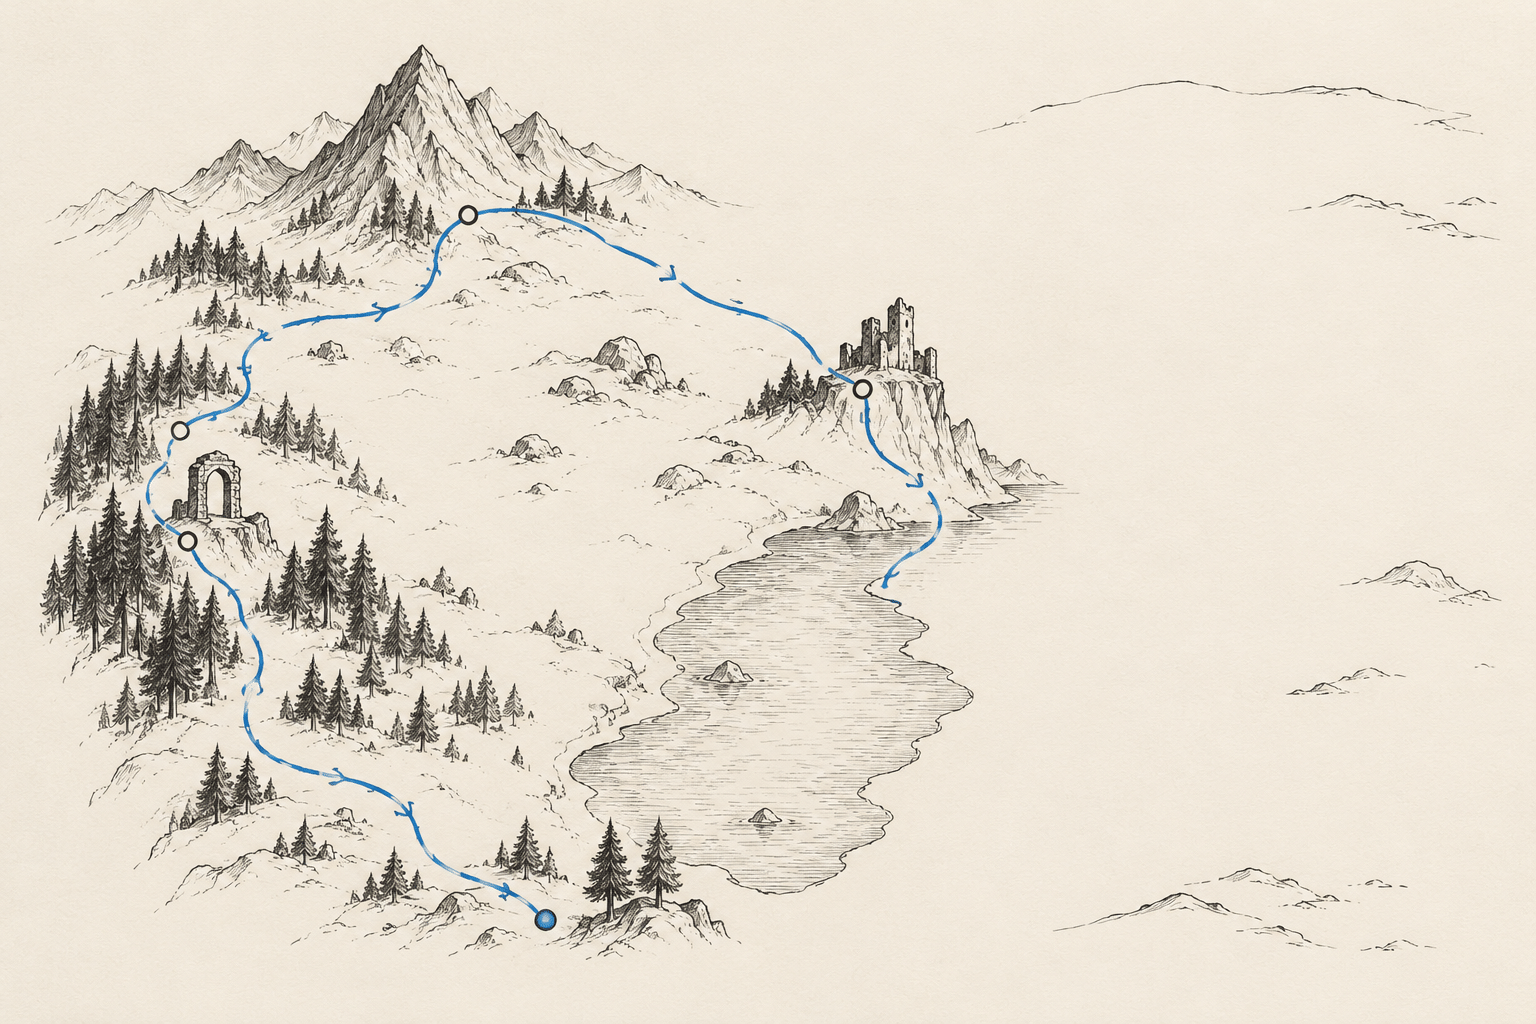
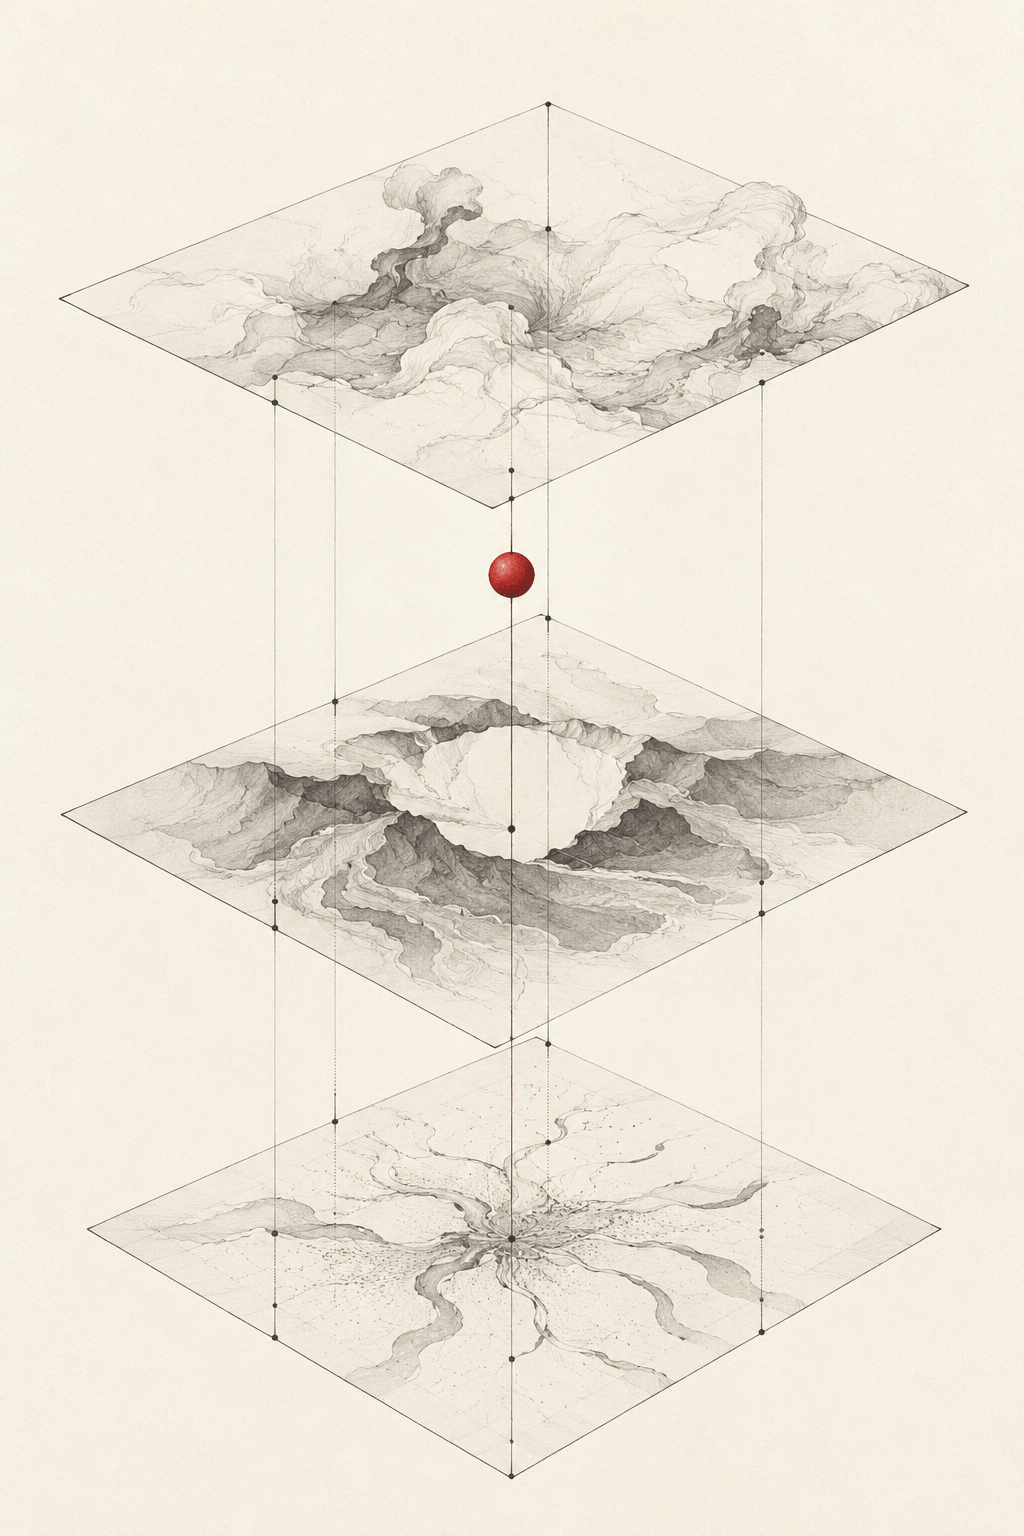
The new gallery proposes an invented network, a cutaway plant-like structure, a sequence of transformations, an imagined walking map and a layered spatial study. These AI-generated images are artistic illustrations rather than verified scientific or engineering diagrams. They avoid fabricated factual labels and connections involving real people.
For a useful prompt, specify the subject, relationship, visual key and reading direction. “An invented network with three clusters, one bridging path and a single red emphasis” is more controllable than “complex diagram art.” If exact connectivity matters, construct and validate the diagram from structured information; use generative imagery for visual exploration rather than as proof of correctness.
Positive editorial assessment — AI-authored
Diagrammatic drawing can reveal patterns that a conventional scene conceals. Its economy makes relationships available for comparison, while line and spacing can give those relationships an expressive rhythm. The strongest work lets viewers inspect both the visible structure and the assumptions used to construct it.
Critical editorial assessment — AI-authored
A polished diagram can make an unsupported association look authoritative. Decorative arrows and unexplained symbols may create the appearance of analysis without doing the work. Improve a drawing by defining its conventions, separating evidence from invention and removing connections whose meaning cannot be explained.
Neutral editorial assessment — AI-authored
Diagrammatic drawing operates across explanation, speculation and fine art. Its appropriate level of precision depends on its purpose. An expressive invented system and an evidence-based analytical diagram can both be valuable, but readers should be able to tell which kind they are viewing.
A small poetic detour
Original words from the AOI studio.
Poetry
A line proposes: these belong.
A gap replies: perhaps they do.
The arrow points, but may be wrong;
the page must show its reasons too.
We map a thought, then turn the sheet
and find a path we had not drawn.
The places where the branches meet
are questions waiting to go on.
The prompt workshop
Original creative exercises. These prompts create new illustrations, not documentary evidence.
A fictional network
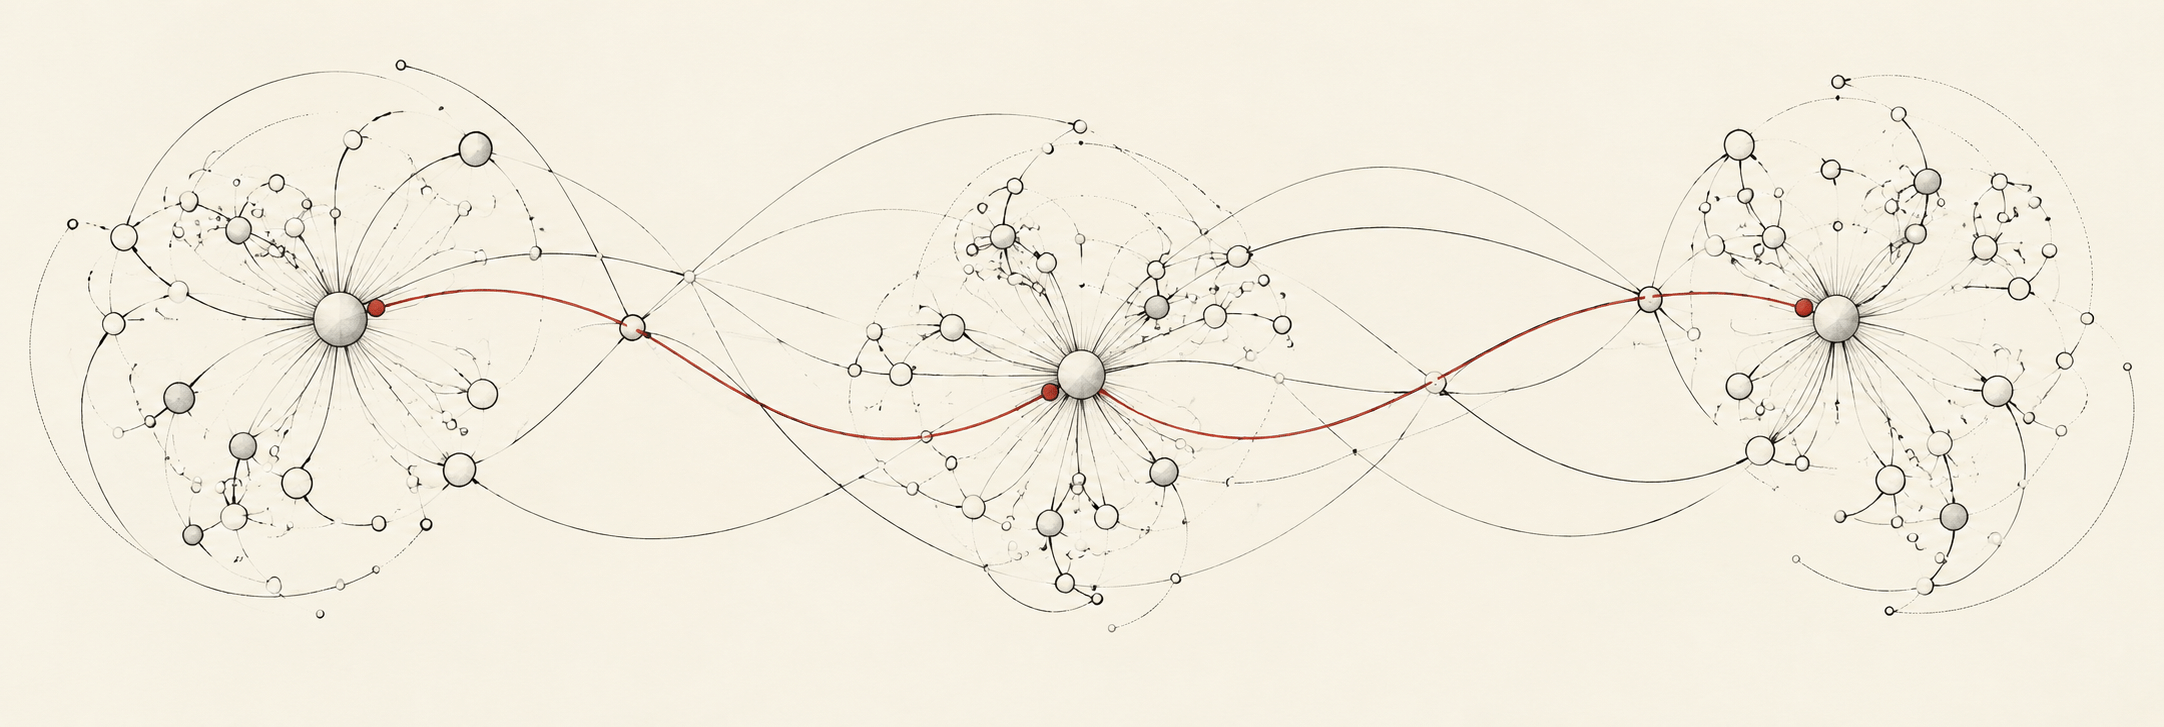
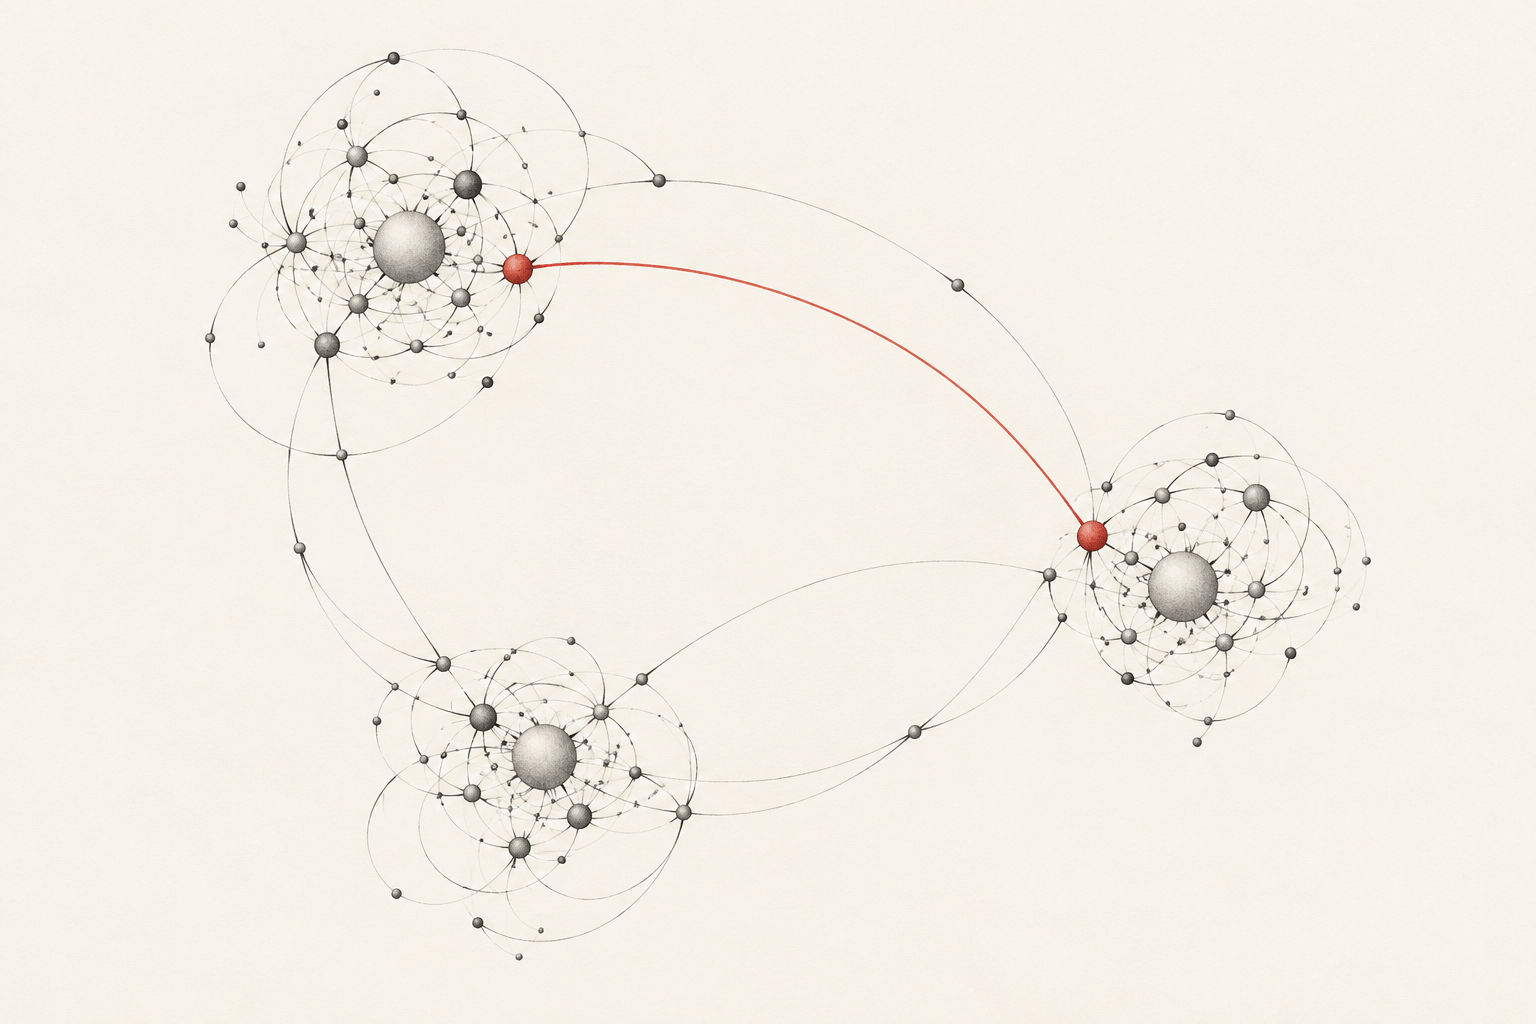
Original artistic diagram of an invented network: three loose clusters of small circles connected by delicate graphite arcs, one red bridging path and generous ivory space. No names, numbers or real-world claims; a visual study of connection and separation.
A transformation sequence
Original diagrammatic drawing showing a simple leaf-like form becoming an abstract branching network across five evenly spaced stages. Fine black line, restrained pale-green accent, clear left-to-right progression and no scientific claim or labels.
A memory map
Original fictional walking map with a looping path, three small landmark symbols and a broad empty region suggesting an unvisited place. Hand-drawn ink on warm paper, one blue route accent, coherent crossings, no real street names or geographical claim.
Your next inspiration
Discover another art style
Follow a visual thread to the next subject.
Perspective Drawing: A Coherent View into Space
Compare explanatory diagrams with spatial projection.

Digital Drawing: Line, Layers and Deliberate Visual Decisions
Explore digital drawing as a production method.
A smile from the studio
Jokes
The arrow insisted it knew the way. The legend asked what it actually represented.