AOI experimental visual concept
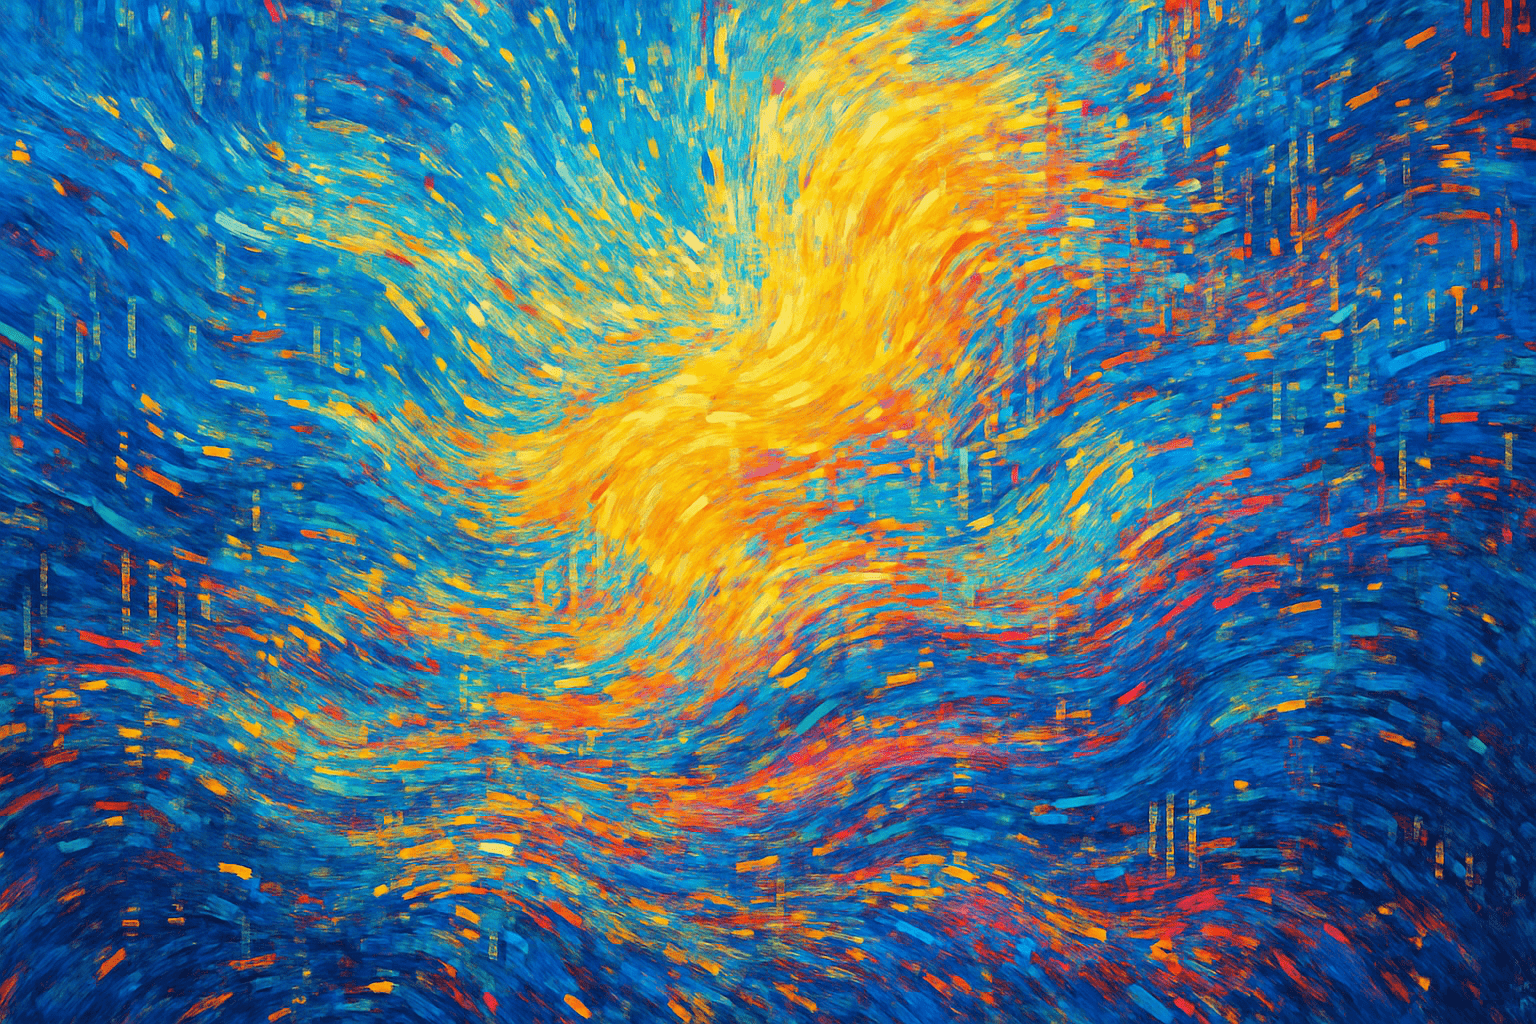
Data Flux Impression is an AOI experimental image concept in which directional marks, density changes and layered fields suggest information moving through a system. It can be developed as an expressive metaphor or connected to a real dataset, but those are different practices. An invented stream of marks is not a scientific visualisation simply because it resembles one.
An A⊕I –[-.+] creαt¡ve c⊕ncept, n⊕t αn estαbl¡she∂ h¡st⊕r¡cαl m⊕vement.
A visual introduction
Select an image for a closer look. Use the thumbnails, arrow keys or a swipe to compare examples. Zoom in to inspect details, or share the image that inspires you.
Creative toolbox · take this style further
Choose an input and a destination. Search sends your words to the chosen site; Copy & open puts them on your clipboard to paste there.
Create with AI
Turn your chosen input into an image prompt or a new creative direction.
ChatGPT
Copy your input and paste it into a ChatGPT conversation or image request.
Copy & open ChatGPT (new tab)Claude · Anthropic
Develop an image prompt or explore the style in a new Claude conversation.
Copy & open Claude · Anthropic (new tab)Midjourney
Paste your input into the Imagine bar on the Create page.
Copy & open Midjourney (new tab)Adobe Firefly
Copy your input, open Firefly, and paste it into the prompt field.
Copy & open Adobe Firefly (new tab)Leonardo.Ai
Copy your input, open Leonardo, and paste it into the generation field.
Copy & open Leonardo.Ai (new tab)Image search
Find visual references. Short, concrete keywords usually work best.
Lexica
Search AI images and prompts using your selected input.
Search with this input Lexica (new tab)Pexels
Search the photo and video library. Short keywords often work best.
Search with this input Pexels (new tab)Pixabay
Search photos, illustrations and other images.
Search with this input Pixabay (new tab)Unsplash
Search photographs using the style name or your own keywords.
Search with this input Unsplash (new tab)Wikimedia Commons
Search photographs, artworks and historical images. Check each file for its source and reuse terms.
Search with this input Wikimedia Commons (new tab)Art & research
Explore artists, collections and the ideas behind a style.
Wikipedia
Search for background reading. A style may not have its own article.
Search with this input Wikipedia (new tab)WikiArt
Copy your input into WikiArt’s search to explore artists and artworks.
Copy & open WikiArt (new tab)Europeana
Paste your keywords into the search to explore European museum, library and archive collections.
Copy & open Europeana (new tab)Inspiration
Discover portfolios and visual ideas from creative communities.
Instagram hashtags
Search a hashtag made from your input: spaces and punctuation are removed. Instagram may require sign-in.
Search with this input Instagram hashtags (new tab)ArtStation
Paste your input into artwork search for concept art, environments, characters and visual development.
Copy & open ArtStation (new tab)Behance
Paste your input into project search for illustration, design and visual storytelling.
Copy & open Behance (new tab)A closer look
Fine marks gather into currents, cross quieter intervals and change density near a focal region. A limited colour key and a dominant direction keep the field readable instead of turning it into decorative digital noise.
Decide whether the marks represent anything
For an expressive study, the marks may describe an imagined flow without numerical meaning. Label the image accordingly. For a data-based work, specify the source, the variables and the mapping: what determines a mark's position, length, colour or opacity? A viewer should not have to guess whether a dense patch means more observations, greater intensity or simply an artistic preference.
This AOI formulation does not claim a historical school or a scientific discovery. Its purpose is to organise a visual problem: how can many small events become a legible larger rhythm while retaining a sense of change?
Build the field before the detail
Choose a dominant direction and two or three broad currents. Establish where marks enter, where they gather and where they disperse. Draw that structure with a handful of broad strokes before subdividing it into particles or short lines. If the large pattern is weak, adding thousands of marks will only make the weakness harder to see.
Quiet areas matter because they let density become meaningful. Leave at least one substantial interval with few marks. Use a gradual density change when the flow should feel continuous, and a sharp interruption when a threshold or obstruction is the subject.
Use colour as a consistent variable
In a metaphorical composition, colour can separate warm and cool streams or identify a focal convergence. In a data-based image, keep the legend stable and choose a mapping suited to the variable. Do not imply a meaningful ranking through lightness if the categories have no order.
Transparency can show overlapping fields, but it also changes apparent density. A dark patch may result from many translucent layers rather than a larger underlying value. If factual interpretation matters, make that limitation explicit and test whether the image remains understandable with the layers separated.
Avoid the generic dashboard effect
Unexplained numbers, fake code and decorative charts create the appearance of evidence without providing it. An expressive work does not need those accessories. It can communicate acceleration, congestion or dispersal through the marks themselves. If labels are included, make them accurate and purposeful.
This separates the concept from a conventional dashboard, which prioritises reliable comparisons, and from a random particle texture, which may have no organising flow. A successful interpretation combines an expressive field with rules that can be described and repeated.
One experiment, three outcomes
Keep the frame, palette and total number of marks fixed. Make one version with an even distribution, one with a narrow convergence and one with a broad dispersal. Compare the apparent energy of each. The experiment reveals how arrangement changes the reading without pretending that an invented image is measured information.
When using actual data, preserve the unmodified source separately and record the transformations. A beautiful image is more useful when its factual and expressive layers can be distinguished.
A small poetic detour
Original words from the AOI studio.
Poetry
Circuits weave stories / Digital dreams pixelate / Light dances through code.
The prompt workshop
Original creative exercises. These prompts create new illustrations, not documentary evidence.
A visible current
Create an original abstract Data Flux Impression study with three fine-line currents converging into one bright region, restrained cyan and amber palette, generous quiet space and no numbers or code. Treat it as an expressive metaphor, not measured data.
Flow interrupted
Design an original field of short directional marks diverted around one empty circular region. Keep a dominant left-to-right flow, controlled density and a consistent three-colour palette. No decorative charts or invented labels.
Distribution experiment
Create three abstract panels with the same number of fine marks and identical palette: evenly distributed, tightly converging and broadly dispersing. Make the change in spatial rhythm easy to compare; no claims of scientific measurement.
Your next inspiration
Discover another art style
Follow a visual thread to the next subject.